
.png)


A thousand visitors arrive on your store today. Twenty of them will buy.
The other nine hundred and eighty are not lost causes, and most left for reasons you control. A slow page, a shipping cost revealed too late, a form asking for information nobody wanted to give.
Buying more traffic to fix that is the expensive answer. Fixing the leak costs nothing per visitor and improves every channel you already pay for.
Your ecommerce conversion rate is the figure that tells you which of the two you should be working on.
What is an Ecommerce Conversion Rate?
It is the share of visitors who complete a desired action, most often a purchase. It answers one question: how well does the traffic you already have turn into sales?
The desired action does not have to be a sale. Signing up for a newsletter, creating an account, or adding to cart are all conversions worth tracking separately.
It is a ratio, not a volume. A store can grow its revenue while its conversion rate falls, which usually means it bought traffic that converts worse than the traffic it had.
How to Calculate Your Ecommerce Conversion Rate
Step 1: Track Total Website Visitors (Sessions)
Start with the denominator. Most reporting tools count sessions rather than people, so a visitor who returns three times in thirty days counts three times.
Exclude your own team and any bot traffic your web reports can identify. Internal visits inflate the denominator and quietly depress the rate you report.
Step 2: Monitor Total Conversions
Count completed orders over the same period, not basket additions. Mixing the two is the most common reason two reports on the same store disagree.
Decide how you treat refunds and cancellations, then keep that choice. Consistency matters more than which convention you pick.
Step 3: Apply the Conversion Rate Formula
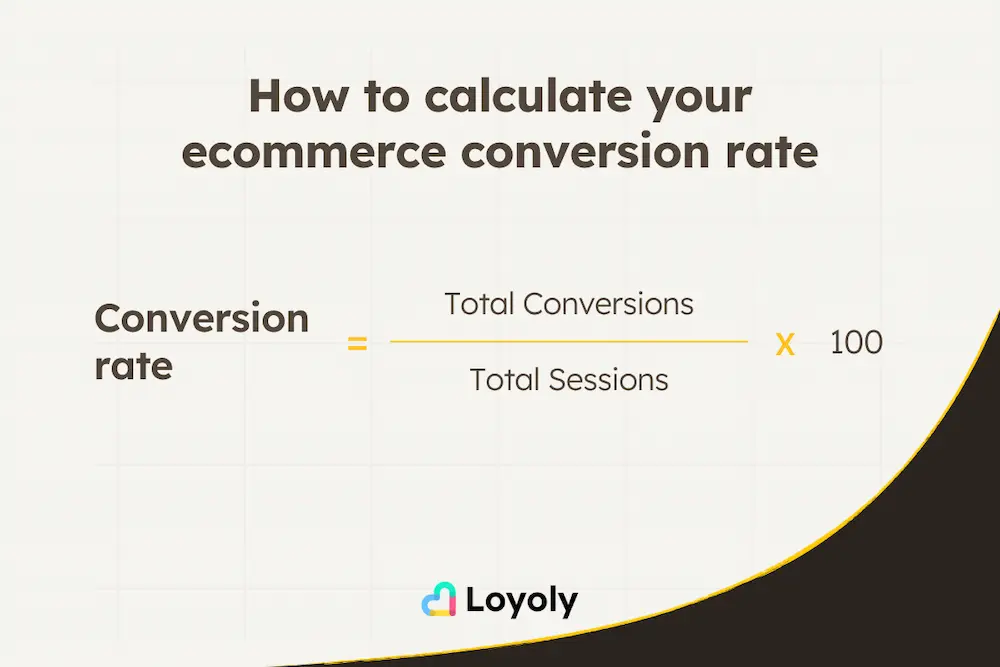
Conversion Rate (%) = (Total Conversions ÷ Total Sessions) × 100
Divide conversions by sessions, then multiply by a hundred. Four hundred orders on twenty thousand sessions gives you a 2% conversion rate.
Calculate it monthly at store level and weekly for anything you are actively testing. Daily numbers on a small store are noise.
Sessions vs. Users: Which Denominator to Use?
Sessions are the standard, and they are what benchmarks use. Users give you a higher number because a single person browsing three times counts once.
Pick one and label it everywhere. Comparing a session-based rate to a user-based benchmark is how teams talk themselves into problems they do not have.
Average Ecommerce Conversion Rate Benchmarks for 2026
Published averages disagree, and the disagreement is methodological rather than real. Panels of small stores report lower numbers than panels of enterprise clients who have already done years of optimization work, so read every benchmark alongside the sample it came from.
- Global average: around 2.2% across tracked sectors (IRP Commerce, July 2026), against 1.4% on a panel of 2,800 Shopify stores (Littledata) and 2.95% among Dynamic Yield clients, a sample weighted toward large optimized sites.
- By industry: from 5.23% in arts and crafts down to 0.55% in baby and child, on IRP Commerce's July 2026 data. Considered purchases sit at the bottom, low-price repeat categories at the top.
- By device: 1.9% on desktop against 1.2% on mobile in Littledata's Shopify panel, a gap of roughly a third, even though mobile carries the larger share of sessions.
- By traffic source: email around 4.2% and referral traffic close behind, organic search near 2.8%, paid search near 2.5%, and paid social around 1.1%.
- New versus returning: returning buyers convert several times better than first-time visitors, which is why a store's mix of new and repeat traffic moves the overall number as much as any optimization does.
- Cart abandonment: 70.22% on average, from 50 studies compiled by the Baymard Institute between 2006 and 2025.
The last two lines matter more than the headline average. A store that grows its share of returning shoppers raises its store-wide conversion rate without touching a single page.
Treat these conversion rates as a range, not a target. The average conversion rate of a panel says more about the panel than about your store, and the useful comparison is always your own trend.
Two stores in the same industry can post conversion rates a factor apart for reasons unrelated to quality. Price point, delivery promise, and brand recognition each move the result before any optimization does.
What is a "Good" Ecommerce Conversion Rate?
Understanding Context: Why Benchmarks Vary
What counts as good depends on what you sell and at what price. A 1% rate on a thousand-euro item can be far healthier than 5% on a ten-euro one.
Traffic mix explains most of the rest. A store living on paid ads will read lower than a comparable business fed by email and organic search, with nothing wrong on either site.
The average conversion rate you should care about is your own from last year. Industry averages are useful for sanity checks and useless as targets, because no published benchmark shares your traffic mix.
Chart your conversion rate against your own history every quarter. A rate climbing slowly on stable traffic is the clearest sign the work is landing.
Set your own benchmarks from your own data. Twelve months of conversion rate by period, by device, and by traffic source gives you a baseline no industry average can replace.
Key Funnel Metrics: Add-to-Cart & Checkout Completion Rates
The overall number hides where the problem sits. Add-to-cart rate tells you whether your product pages persuade; completion rate tells you whether the payment step gets in the way.
The shopping experience is what the rate measures. Every friction in the shopping journey shows up in the same figure, which is why a single figure can move for a dozen unrelated reasons.
Read them together. A healthy add-to-cart rate with weak completion points squarely at shipping costs, payment options, or a forced account creation.
Factors Impacting Your Ecommerce Conversion Rate
Speed, Design, and Mobile Performance
Speed is the factor with the widest reach, because it affects every page. Visitors abandon a site that takes more than three seconds to load, and mobile connections are where that shows first.
Design decides the rest. If a visitor cannot tell what you sell and where to buy it within a few seconds, no amount of traffic fixes the outcome.
Mobile deserves its own conversion rate, tracked separately. A shop whose mobile rate sits well below its desktop rate has a mobile problem, not a conversion problem, and the fix is different.

Product Presentation and Copywriting
A product page answers what a shopper would otherwise ask a salesperson. Sizing, materials, delivery dates, and what happens if it is wrong matter more than atmosphere.
Images carry more weight than words here. Multiple angles, a sense of scale, and one photo in a real setting settle more doubts than a paragraph of description.
For example, adding a size guide to one category can lift its conversion rate while the store average barely moves. That is normal, and it is why segment-level rates tell you more than a store-wide figure.
Trust Signals and Social Proof
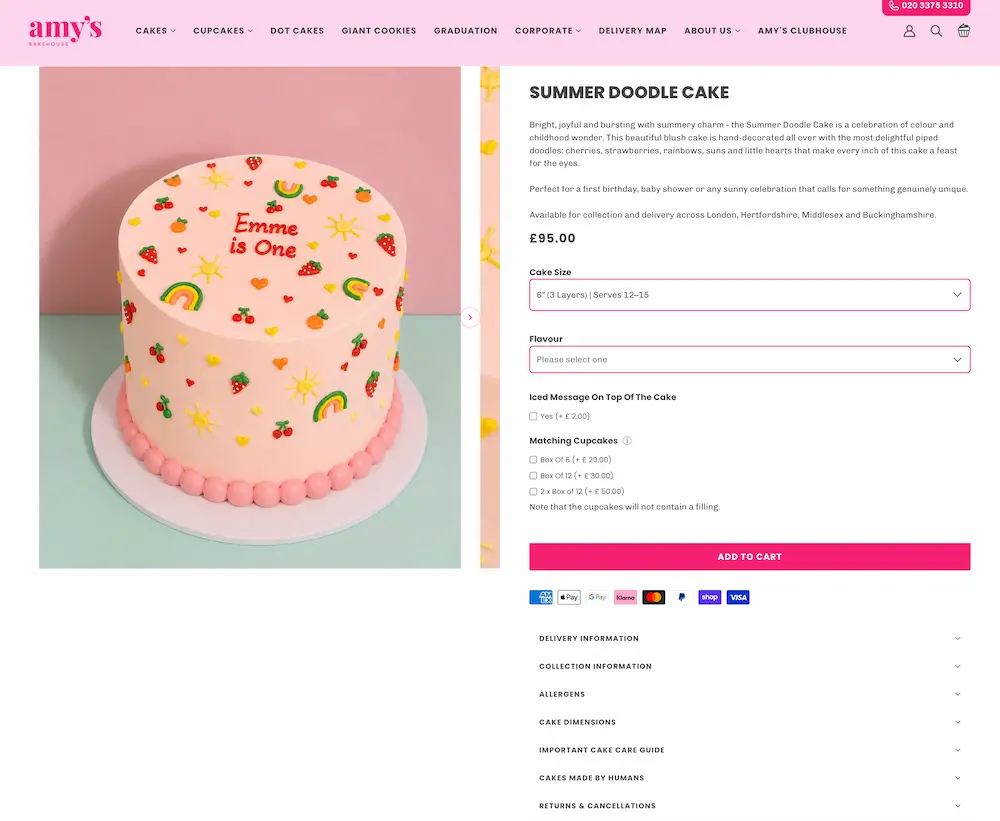
Trust is what a first-time visitor is missing. Reviews, a real address, a visible phone number, and clear return terms all reduce the perceived risk of ordering.
Specificity is what makes it work. Twelve detailed reviews on one item convince more than a badge claiming thousands of happy buyers.

Payment Options and Checkout Friction
Payment is where intent turns into revenue or evaporates. Every extra field, step, and surprise reduces the number of shoppers who finish.
Offer the payment methods your market actually uses. Cards, wallets, and installments each suit a different buyer, and completion rises with every relevant option you add.
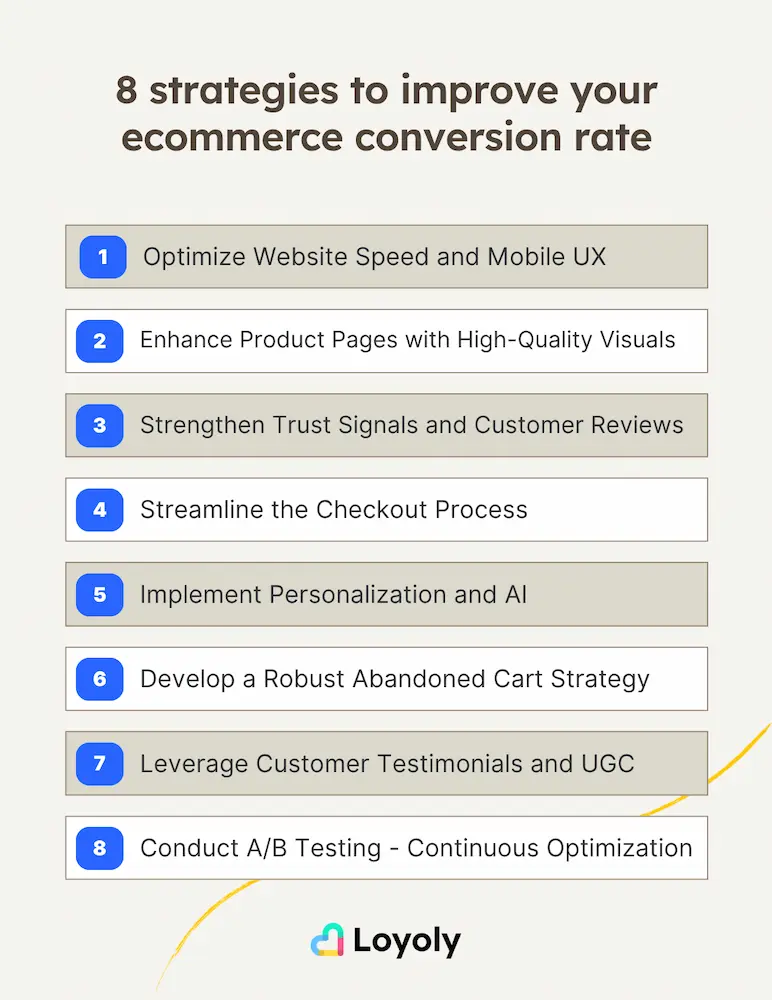
Strategies to Improve Your Ecommerce Conversion Rate
Optimize Website Speed and Mobile UX
Compress images, remove the scripts you no longer use, and test on a real phone rather than a desktop simulator. Free tools will tell you what to fix first.
Design for a thumb. Buttons large enough to hit, forms that use the right keyboard, and a sticky buy button all help the device where most of your sessions happen.
Enhance Product Pages with High-Quality Visuals and Copy
Put price, delivery date, stock, and the buy button above the fold on every listing. Everything below is a bonus for the shoppers who want more detail.
Rewrite your best-selling listings first. They already carry the traffic, so every improvement there pays back immediately.
Strengthen Trust Signals and Customer Reviews
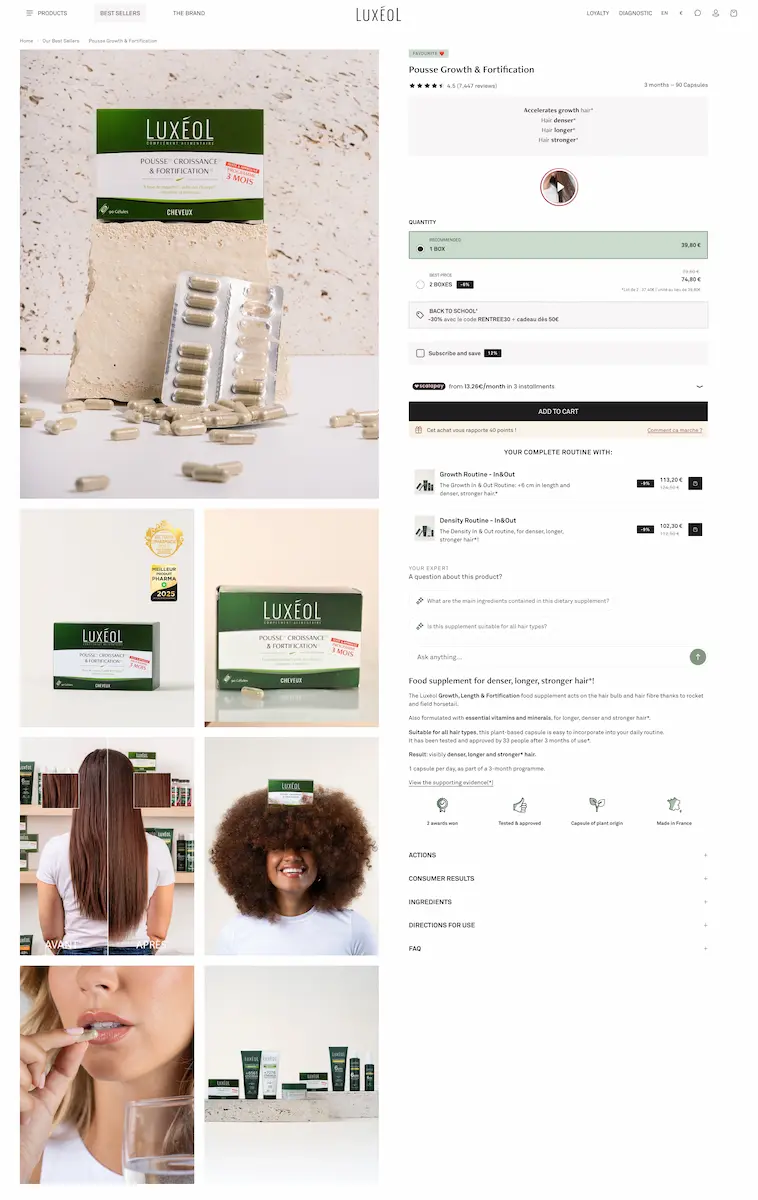
Reviews are the strongest trust signal you can add, and the hardest to collect passively. Most satisfied customers never leave one because nobody asked.
A customer loyalty software solves the asking. It rewards buyers for leaving a review on the platform you already use, which turns an occasional trickle into a steady flow.
The same program lifts the rate a second way. Repeat visitors already trust the delivery and the sizing, so their conversion rate starts higher than any landing page can achieve.
Streamline the Checkout Process (Guest Checkout, Wallets)
Let people order without an account. Forcing sign-up is the most common self-inflicted wound in ecommerce, and removing it lifts completion immediately.
Show the full price early, delivery included. Unexpected shipping at the final step is the leading documented reason shoppers abandon a cart.
One example is worth testing before anything cleverer: free delivery above a threshold usually lifts conversion rates and average order value at the same time.
Implement Personalization and AI-Driven Recommendations
Dynamic recommendations built on real behavior outperform a static bestsellers block. Recently viewed, frequently bought together, and back-in-stock are the three that earn their place.
Personalize the offer, not just the layout. A repeat buyer who sees their size in stock and their points balance is being sold to more precisely than any banner manages.
Develop a Robust Abandoned Cart Strategy
Three emails beat one: a reminder within an hour, a nudge the next day, and a last message with a reason to return. Most of the recovered revenue comes from the first.
Give people a reason that is not a discount. A reward balance waiting at payment recovers carts without training your shoppers to abandon on purpose.
Leverage Customer Testimonials and User-Generated Content
Customer photos convert better than studio images on most catalogs, because buyers recognize a real setting. They also cost a fraction of a shoot.
Rewarding content is how you get a steady supply. A program that credits shoppers for posting a photo or filming a short video turns social proof into a repeatable process.
.webp)
Conduct A/B Testing and Continuous Optimization
Test one change at a time, on the pages with enough traffic to reach significance. A/B testing on a page with two hundred monthly sessions produces opinions, not results.
CRO is the discipline behind all of this. Conversion rate optimization means running a queue of hypotheses against your own data rather than copying what worked for someone else.
Rank your fixes by traffic before by effort. A change on the page carrying a fifth of your sessions moves conversion rates more than a perfect fix on a page nobody visits.
Write the hypothesis before the test. "Removing the phone field will lift completion" is testable; "make payment easier" is not.
Watch what a change does to conversion rates on mobile specifically. Fixes that help on a large screen sometimes do nothing on a small one, and the average hides both results.
Measuring and Analyzing Your Conversion Rate Effectively
Utilizing Analytics Tools (e.g., Google Analytics 4)
Set up ecommerce tracking properly before trusting any number. Google Analytics 4 needs order events configured, and a store reporting from two systems will report two different rates.
Cross-check against your platform's own reports each month. When your reports and the back office disagree by more than a few percent, fix the tracking before acting on either.
Segmenting Data for Deeper Insights
An overall rate tells you almost nothing. Segment by device, by source, by new versus returning, and the problem usually identifies itself.
Look at your worst-performing segment with real traffic. That is where the same effort produces the largest improvement store-wide.
Track conversion rates by cohort, not only week by week. A rate that looks stable can hide a rising rate for returning buyers and a falling one for newcomers.
Segmenting is also how you avoid false alarms. A dip in the store-wide conversion rate after a campaign usually means the campaign brought colder traffic, not that the site broke.
Monitoring Key Performance Indicators (KPIs) Beyond CVR
Watch average order value and revenue per session alongside the rate. A conversion rate that rises while revenue per session falls means you sold more cheap orders, not more value.
Add cart abandonment rate and repeat purchase rate to the same view. Together they tell you whether the problem is the payment step or the relationship.
A CRO program needs a rhythm more than a budget. One test live at all times, one review each quarter, and a written record of what failed: that is what separates teams who improve their conversion rate from teams who discuss it.
Frequently Asked Questions About Ecommerce Conversion Rates
How do I calculate conversion rate correctly?
Divide orders by sessions over the same period and multiply by a hundred. Use one denominator consistently, and exclude internal and bot traffic.
What is the average conversion rate for ecommerce in 2026?
Roughly 2.2% across tracked sectors according to IRP Commerce, with published panels ranging from 1.4% to just under 3% depending on the sample and the methodology behind it.
What is considered a good conversion rate for an ecommerce website?
Anything comfortably above your own category average and trending upward. On a considered purchase, a third of the rate you would expect on a consumable can be excellent.
How do ecommerce conversion rates differ by industry?
By roughly a factor of ten. IRP Commerce puts arts and crafts near 5.23% and baby and child near 0.55%, driven mostly by price point and how long the decision takes.
What are the biggest factors affecting ecommerce conversion rates?
Page speed, product page quality, trust signals, and checkout friction, in that order for most stores. Traffic mix sits behind all four and explains more variation than teams expect.
How can I increase my ecommerce conversion rate?
Start with the payment step, then the product page, then speed. Once those are clean, the largest remaining gain usually comes from raising the share of returning customers.
Conversion rate optimization rewards patience more than cleverness. A store that fixes one real problem a month, measures it honestly, and resists the urge to redesign will pass the one chasing benchmarks.
At Loyoly, we help more than 600 ecommerce and retail brands turn one-off buyers into repeat customers, through loyalty, referral, and post-purchase engagement. If lifting the share of returning shoppers is on your roadmap, it is worth a conversation: book a demo.




.webp)